
By Jiayi Liang, Equity Analyst
Over the last fourteen decades,the S&P 500 dividend per share has increased significantly from $.07 per share in 1880 to over $.60 in 2020. These numbers are adjusted for inflation. So this means that, even when we factor out inflation, America’s largest companies have grown their dividends by almost 1,000% over the last 140 years. The surge is even more noticeable over the last ten years. By announcing and paying higher dividends, companies are sending positive signals to investors and competitors about their solid financial health. Besides, a dividend hike also indicates a win-win situation in which both the company and its shareholders could receive much more benefits. This attractive growth leads to the question: Are there any patterns between dividend growth and other financial metrics? In this article, we are going to compare seven types of financial ratios and rates between top dividend growers and bottom dividend growers, conduct quantitative analysis, and then find out specific patterns.
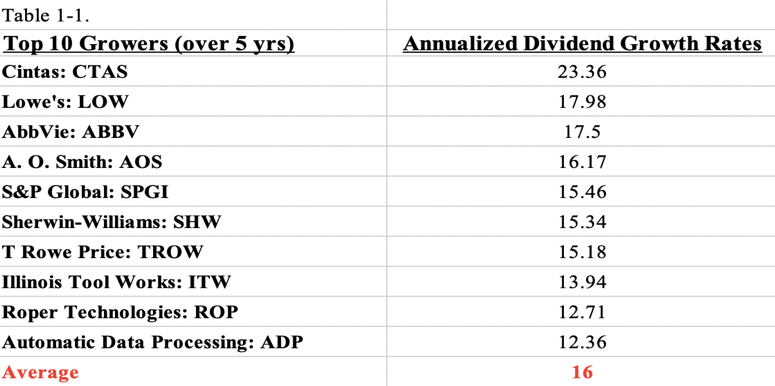
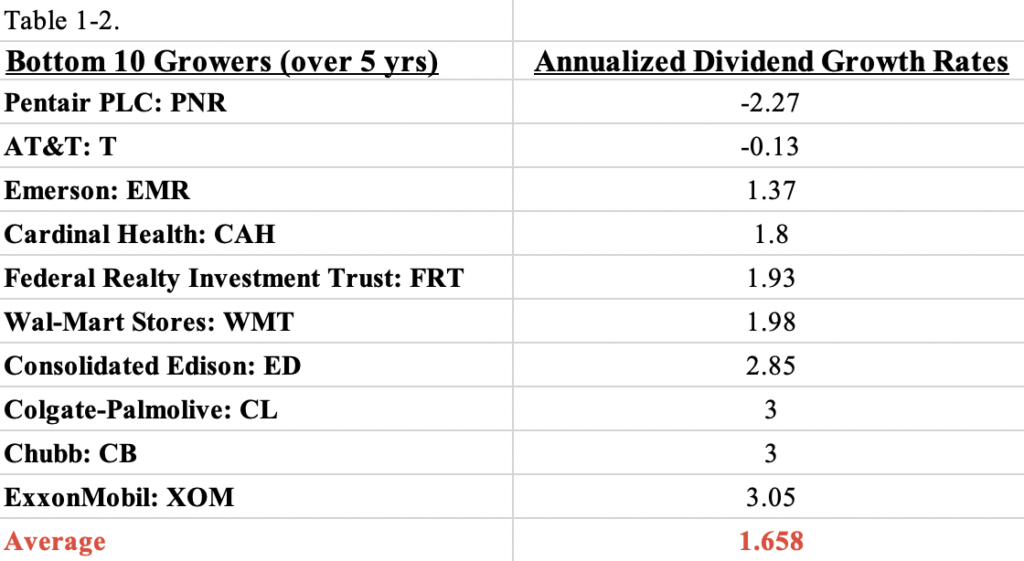
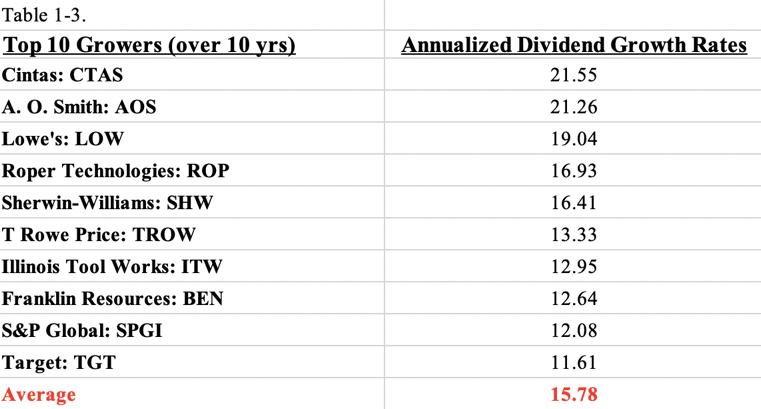
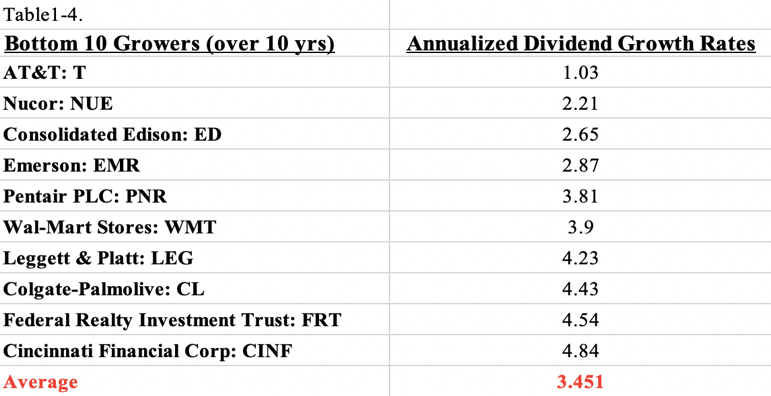
The tables below list the top 10 dividend growers and bottom 10 growers of S&P 500 “dividend aristocrats” over five years and ten years.
Quantitative Analysis
In the following, we are going to conduct quantitative analysis based on seven financial metrics to examine potential patterns related to dividend growth.
1. Debt-to-Equity (D/E) Ratio
Debt-to-equity (D/E) ratio is calculated by dividing the total liabilities of a company by its shareholder equity. It is often used as a measure of a company’s financial leverage and the degree to which shareholder’s equity can fulfill obligations to creditors during a business decline.
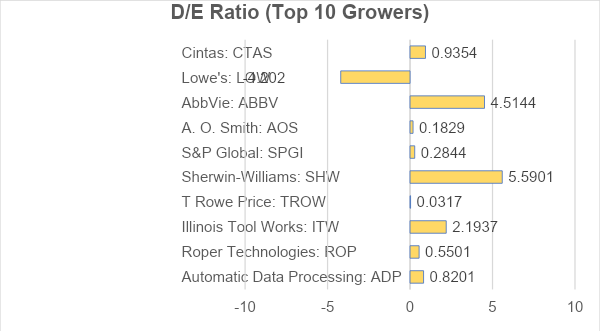
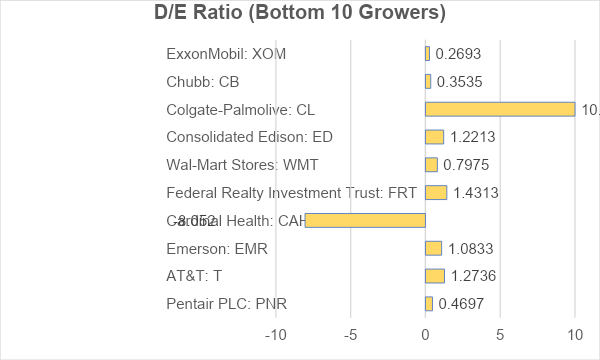
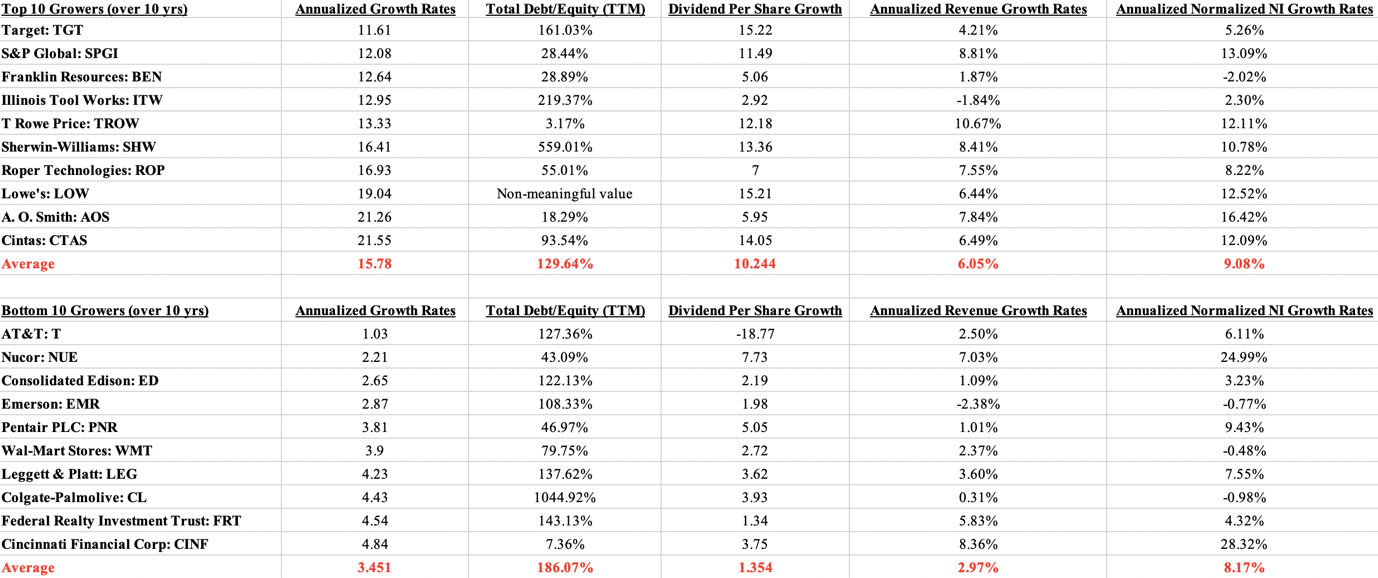
We may not be able to tell any pattern at the first glance, but the data become self-explanatory after calculating the averages: 167.81% for top 10 and 192.76% for bottom 10. This means that, in general, bottom dividend growers tend to have much higher D/E ratios. The gap is even larger over ten years: 129.64% for top 10 and 186.07% for bottom 10. (See Appendix 1) Consistent with the fact that a high D/E ratio is associated with high risk in most cases, the results above clearly verify that companies with more conservative debt are likely to grow much faster.

The pattern makes sense because the more the debt a company is carrying, the more aggressive it is in financing its growth through debt. If the company could gain a greater amount of earnings than the cost of those debt, then the shareholders could expect to receive benefits. Unfortunately, in most cases, such an aggressive financing indicates unsustainable growth which may cause the company to suffer financial distress and unable to pay its creditors in the end.
2. Dividend Payout Ratio
Dividend payout ratio is used to determine the total amount of dividends paid out to shareholders relative to the company’s net income. Due to the facts that dividend payouts vary widely by sector, company’s maturity, and business financial portfolio, it is hard to conclude that a higher dividend payout ratio must be better and vice versa. Usually, a range of 30% to 50% is considered healthy: it indicates that the company is willing to distribute roughly half of its earnings to shareholders while retains an appropriate amount of earnings for future growth. Conversely, a ratio over 50% is often considered risky as it implies there is less room left for the company to further grow.
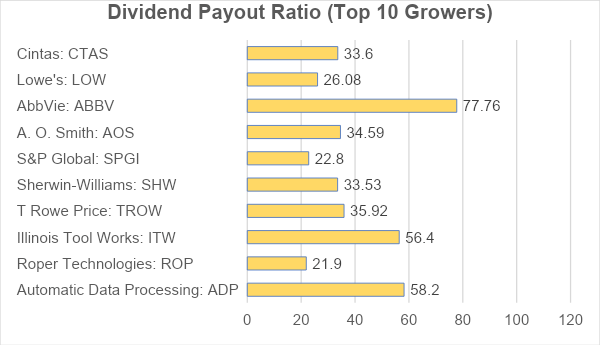
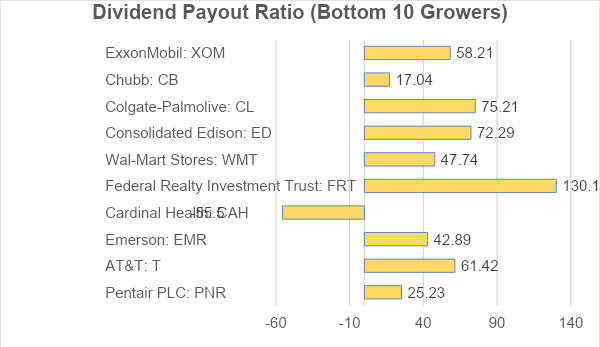
The pattern is clear: most of top dividend growers are on the right track with only 3 of them displaying an over-50% ratio; while in the bottom 10 growers, half of them deliver a payout ratio over 50%. Meanwhile, two extremists stick out. Federal Realty Investment Trust delivers a 130.18% payout ratio, distributing an excessive amount to shareholders; Cardinal Health offers a -55.5% payout ratio, suffering negative earnings. Both companies have an unreasonable payout ratio which leads to unsatisfactory dividend growth.
By calculating averages, our findings also perfectly match the theory stated earlier: top 10 dividend growers have a payout average of 40.08% which is exactly within the ‘healthy’ range, while bottom 10 growers have a payout average of 58.91%.
3. Dividend Per Share (DPS) Growth
Dividend per share (DPS) is the sum of declared dividends issued by a company for every ordinary share outstanding. The higher the growth rate of DPS, the more confidence a company’s management shows in its profitability and earnings growth sustainability.
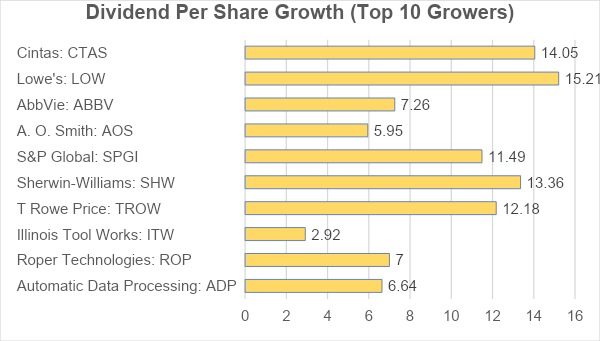
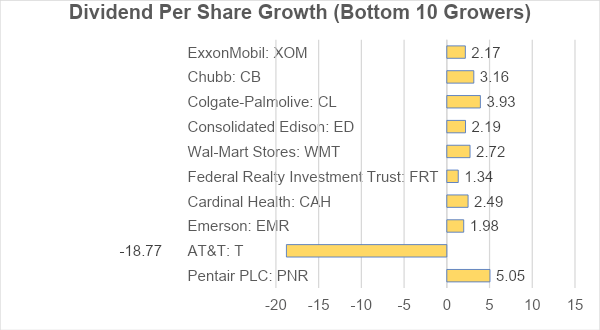
Based on the charts above, we could easily see that, in general, top 10 dividend growers over five years tend to grow their dividend per share much faster. Specifically, top growers deliver an average DPS increase of 9.606, with the maximum of 15.21 from Lowe’s and a minimum of 2.92 from Illinois Tool Works. On the other side, bottom 10 growers’ average is only 0.626, with the highest 5.05 from Pentair PLC and the lowest -18.77 from AT&T.
The positive relationship between dividend growth and DPS growth is further validated if we compare data over a longer period: an average of 10.244 DPS increase for ten-year top 10 dividend growers and 1.354 for the bottom 10. (See Appendix 1)
Thus, it is very likely to believe that, even though the total amount of shares may vary year by year, the dividend increase from top growers tends to outstrip the increase of shares, holding their dividend per share growth to a positive trajectory.
4. Forward Free Cash Flow Per Share Growth Rates
Free Cash Flow Per Share is used by investors to evaluate a company’s financial and operational flexibility, which is calculated by free cash flow divided by the total number of shares outstanding. Since it is a forward rate, a higher growth rate indicates that the company is regarded as generating more cash flow than is required in the future.
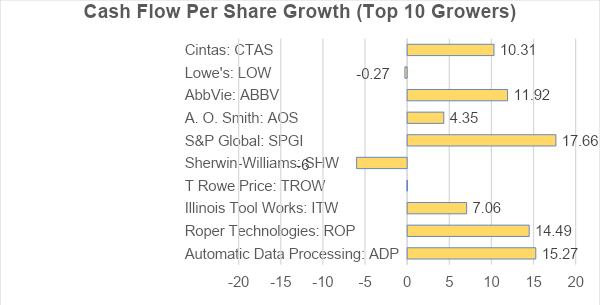
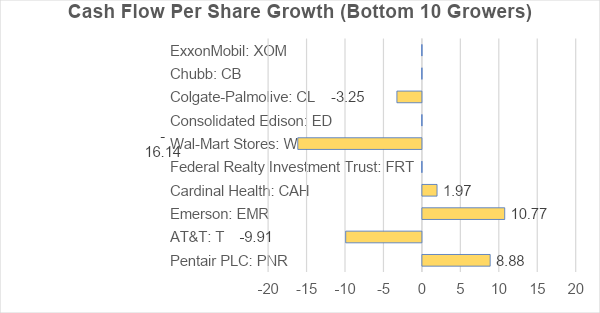
As demonstrated above, companies with faster dividend growth are likely to have much higher cash flow growth rates. In detail, average forward growth rate for five-year top 10 dividend growers reaches 8.31 while the average for bottom 10 is only -1.28. This means that the public does not have much confidence in those companies and expects them to suffer lower cash flows for the two fiscal years forward. Conversely, companies with faster dividend growth are very promising as people believe them to generate more and more cash flows in the next couple years.
5. Annualized Revenue Growth Rates
Revenue growth is essential for a company as it provides an indication of the health and success of sales. The higher the revenue growth rate, the more the money a company is making, and then the more confidence of investors in the company.
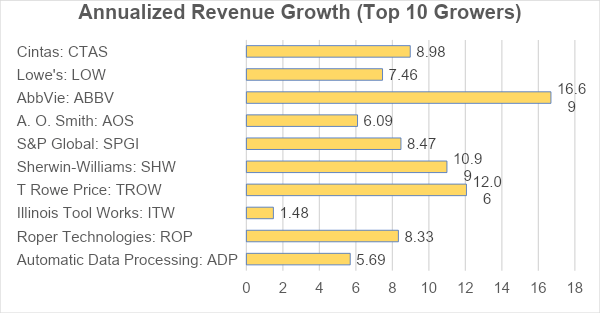
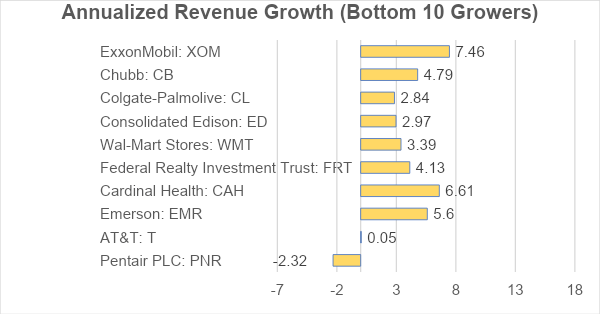
We found out that, in general, fast-dividend-growing companies tend to have higher revenue growth rates. As shown above, 3 from top 10 growers have achieved a revenue growth rate over 10%; none of the bottom growers has done so. Likewise, over ten years, 7 out of 10 leading companies have reached an over-5% revenue growth rate, while only 2 bottom companies have achieved it. (See Appendix 1)
If we look at averages, the pattern still holds: a mean of 8.62% for top 10 growers over five years and a mean of 3.55% for bottom 10; a mean of 6.05% for top 10 growers over ten years and a mean of 2.97% for bottom 10. (See Appendix 1)
6. Annualized Net Income Growth Rates
Basically, net income tells an investor a company’s profitability. Like revenue growth rate, a higher net income growth rate indicates that the company is achieving a financial success.
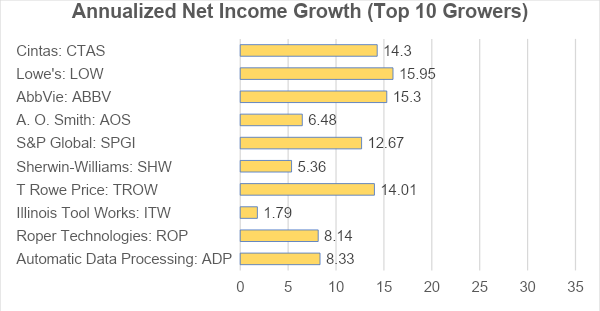
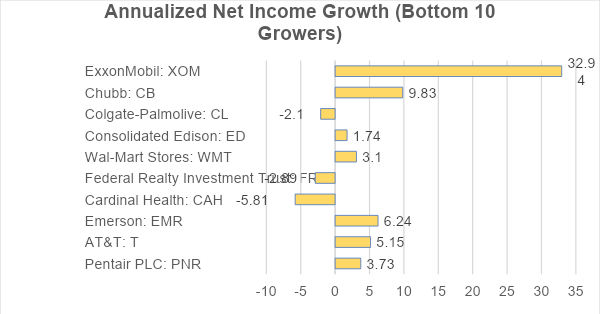
According to the two figures above, the pattern is apparent: on average, faster dividend-growing companies tend to have the ability to increase net income faster and faster over years. In detail, half of the five-year top 10 companies have kept a net income growth rate over 10%; rest of them have also maintained a positive growth. On the other hand, 3 out of 10 bottom companies have suffered a negative net income growth rate, while most of the rest are still on the verge of negligible growth. The pattern shown over ten years is similar: 6 out of 10 leading dividend growers have achieved a 10% net income growth rate or more, while only 2 bottom dividend growers have reached it. (See Appendix 1)
7. Price-to-Earnings (P/E) Ratio
Price-to-earnings (P/E) ratio reveals the valuation of a stock by the market based on its earnings. There are two types of P/E ratio: trailing P/E ratio which relies on the company’s total earnings per share over the past 12 months and forward P/E ratio which is based on the estimated earnings per share in the future. One thing very important is that a pure P/E ratio does not tell investors much information unless they compare it to other companies in the same sector or compare it against the company’s own historical record. In order to yield a reliable insight, we chose to compare the percentages of difference to sector.
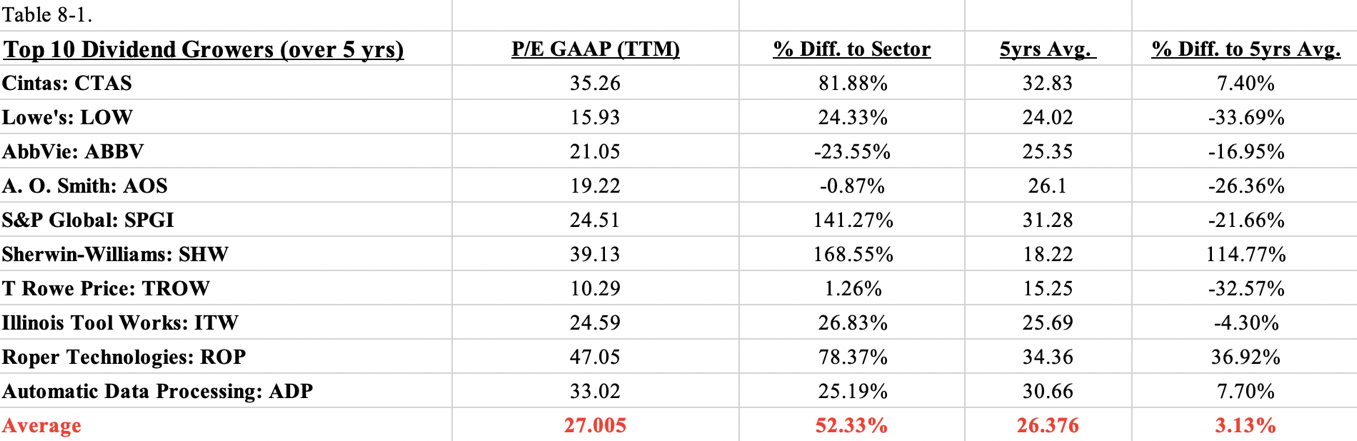
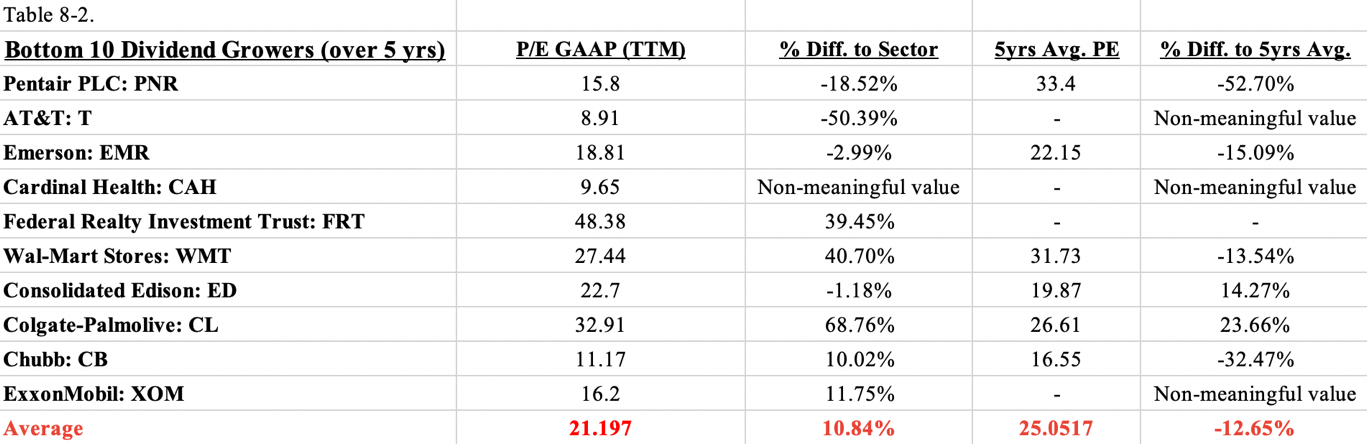
A higher trailing P/E ratio could signal that the market is willing to pay more for a stock based on its past performance relative to its peers. From the two tables above, we could conclude that top 10 dividend growers are more likely to achieve a P/E ratio far exceeding the sector mean. If we look at ‘5-years Average’ column, the finding is even more incredible: on average, these bottom companies’ P/E ratios are far below their sector mean. In other words, they are far left in the dust of their peers in the same sector.
Admittedly, trailing P/E ratio has certain limitations since the past doesn’t tell the future. Many investors prefer to use forward P/E ratio for comparison. A higher forward P/E ratio could imply a higher expectation of growth rates in the future by investors.
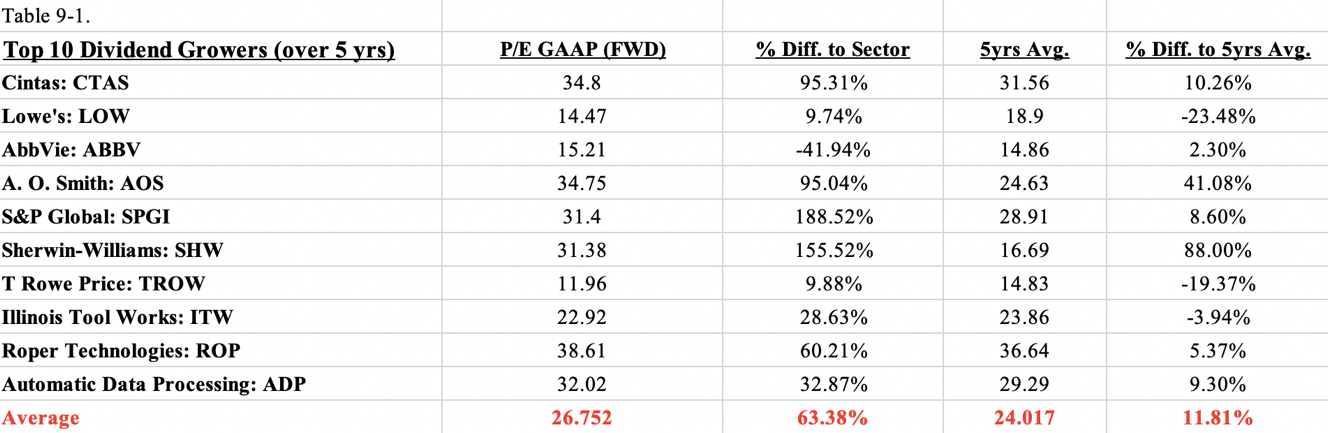
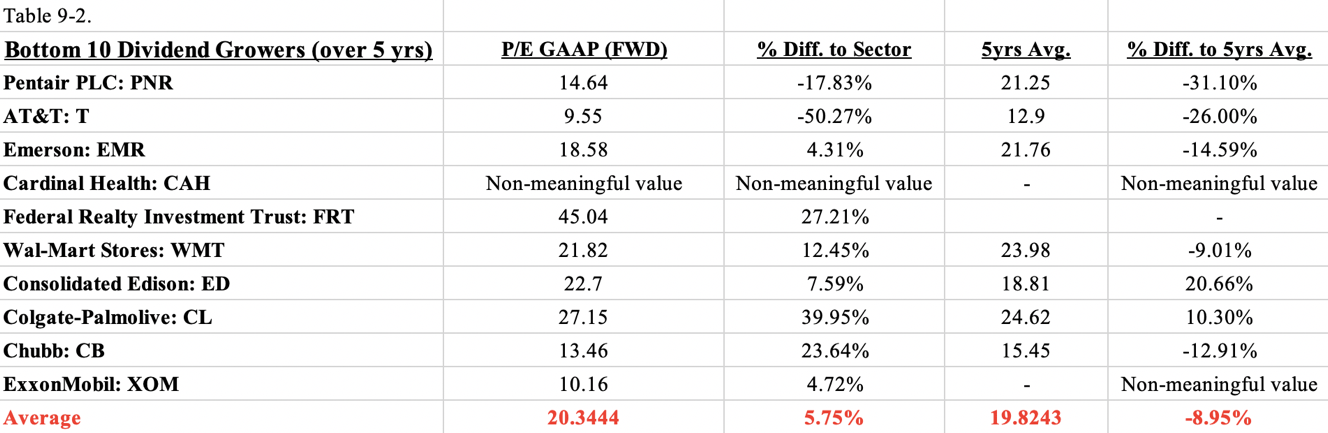
Not surprisingly, we got the same pattern as we found in trailing P/E ratio: the market is willing to pay much more today for a top dividend grower’s stock than for a bottom one. Two representatives are Sherwin-Williams and S&P Global with a forward P/E ratio far outperforming the sector average by 155.52% and 188.52% respectively.
Summary: Release the Beast!
What does a stock look like when it is about to go into “Dividend Beast Mode?”
We have discovered clear patterns between dividend growth and other metrics used for company evaluation. Due to the distinctive financial policies and procedures each company is observing as well as the different ways in which each business is making money, it is unreasonable to assert that a faster dividend growth company must has a higher revenue growth and a lower debt-to-equity ratio. However, when we look at mean values, there does exist evidence showing that a dividend hike does not come out of nowhere. Even within the S&P 500 aristocrats in which all companies have had relative strong financial performances over years, the patterns still hold.
In short, top dividend growers tend to carry less debt, pay out more to shareholders, grow their dividend and cash flow much faster, generate more revenues and net incomes each year, and have higher P/E ratios than bottom dividend growth peers in the same sector. Based on all these standards, we would recommend an investment in Cintas: a debt-to-equity ratio below 1, a payout ratio within 30%-50%, a decent dividend per share growth of 14.05%, a high cash flow growth of 10.31%, a noticeable revenue growth and net income growth, as well as appropriate P/E ratios relative to its competitors by sector.
Appendix 1:
More Stories
DISNEY: THE ENCHANTMENT OF AI FOR THE MAGIC KINGDOM?
MEDTRONIC PLC; A DIVIDEND KING OF THE HEALTHCARE REALM
GE HEALTHCARE: THE IMAGE OF DIVIDEND GROWTH?